If Holliston Decided the Election
If you believe the results of the survey that was posted here last week, Hollistonians don’t care about the environment, are in favor of a Hillary Clinton presidency, and can’t decide whether marijuana should be legalized for recreational use. Before getting to more detailed results, a little bit of exposition is in order.
Obviously the results of an online survey like this are far from scientific and open to a certain amount of manipulation. For what it’s worth, I combed through the responses and was unable to find any evidence of repeated voting and only one instance of an obviously insincere ballot, where Harambe the deceased gorilla was selected to be President.
The survey had 156 participants, though a small number of those closed the survey before completing the entire thing. Of those 156, 54% were men and 46% were women. The age distribution of those who participated skewed towards the middle aged and elderly, with 56% aged 40-64, 25% aged 65 and above, and the remaining 19% split about evenly between the below 25 and the 25 – 39 demographic.
The meat of the survey was divided into three main portions: a presidential section, an issues section, and a ballot questions section. The presidential section, which sampled participants’ stances on the current campaign for the White House as well as the 2012 election and President Obama’s job performance, will be analyzed first.
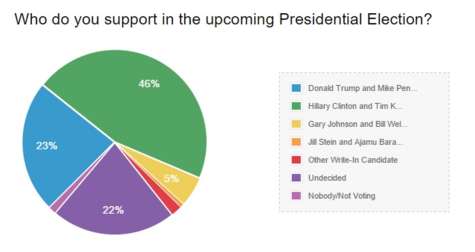
When asked who they would be voting for in the upcoming Presidential Election, respondents gave Hillary Clinton a clear plurality of 47% of the vote compared to Donald Trump’s 24%. Most of the remaining percentage was taken up by undecided voters, at 22%.
In addition to this, the Libertarian Party ticket of Gary Johnson and Bill Weld picked up 5% of the vote while Jill Stein, Bernie Sanders, and Ted Cruz got one vote apiece. Two participants said they supported nobody and were not voting.
Of the portion of voters who were undecided, 85% indicated that they disliked both major party candidates. If asked to express a preference, they were split about evenly between leaning towards Clinton, leaning towards Trump, and leaning towards a third party candidate or write-in.
When asked who they had voted for in 2012, 52% of participants said they had voted for Obama, 37% said they had voted for Romney, and the remaining 11% either voted for someone else or did not vote at all. When asked whether they approve of President Obama’s job performance, 53% indicated that they approve of the President, 38% said they disapprove, and 9% were unsure.
I decided to cross reference these responses to see how people who voted for Obama and Romney in 2012 feel about this year’s race. Of those who voted for Obama, 72% say they are voting for Clinton this year and 5% are crossing over to vote for Trump. The remaining 23% are divided, with some leaning towards Clinton but most opting to vote for a third party candidate or write somebody in.
Former Romney voters were remarkably less enthusiastic with his successor, with 45% voting for Trump this year and 14% opting for Clinton. The remaining 39% is largely undecided, with a plurality leaning towards supporting a third party candidate.
When I went to break down the results by sex and age, the most glaring thing I found was a large gender gap among respondents. Women voted 57% for Clinton and 22% for Trump, with the remaining 21% largely leaning towards Clinton or supporting a third party candidate. In addition to this, women who were not undecided approved of Barack Obama’s performance as President by a 2-1 margin.
Men, on the other hand, were split almost evenly into three camps, with 37% supporting Clinton, 31% supporting Trump, and 32% either leaning towards one of the major party candidates, supporting Gary Johnson, or leaning towards voting for someone else with no apparent trend. Men who were not undecided on Obama’s performance were about evenly split.
When it comes to age, those under 40 turned out to be the least decisive and least Trump-friendly group, with 46% going to Clinton, 12% to Trump, and 46% undecided or leaning third party. Those between 40 and 64 were the most evenly split of the bunch, with 43% supporting Clinton, 32% supporting Trump, and 25% undecided or supporting third party candidates. Those above 65 turned out to heavily favor the Democratic nominee, with 61% supporting Clinton, 17% supporting Trump, and 22% undecided.
Next came the issues section, a much more straightforward portion of the survey where participants were asked to rank eight political topics by importance. Hollistonians overwhelmingly favored ‘Jobs/Economy’ and ‘National Security/Safety’ as the two most important issues listed, with a steep drop between them and ‘Foreign Policy Issues’, which got third place.
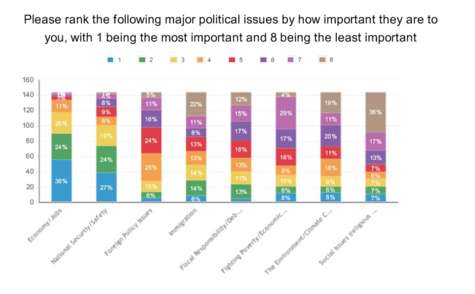
In the middle were ‘Immigration’, with 4th place, ‘Fiscal Responsibility/Debt Reduction’, with 5th place, and ‘Fighting Poverty/Economic Inequality’ with 6th place. ‘Environmental Issues/Climate Change’ and ‘Social/Moral Issues’ brought up the rear, with more than half of respondents placing them in the bottom three.
Immigration was by far the most polarizing of the choices. Immigration averaged 3rd place among Trump supporters, with nobody who supports the Republican nominee ranking immigration as least important. Clinton supporters viewed it very differently, ranking it an average of 6th place in their tally. Moreover, nobody who supported Clinton ranked immigration most important, while almost 40% ranked it as their least important issue.
Last but not least, there are the ballot questions. Four questions have been approved for this year’s Massachusetts ballot, with question 4, regarding the legalization of Marijuana, by far the most publicized.
Question 1 asks whether the state’s Gaming Commission should be able to issue an additional slots license, which would likely go to Suffolk Downs, making it the second slots parlor in Massachusetts. Respondents were decisively against this question, with 51% voting no, 26% voting yes, and 22% undecided.
Question 2 asks whether the state should be allowed to greatly expand the amount of charter schools in Massachusetts, adding a maximum of 12 more charter schools per year. This question was much closer, with 38% voting yes, 44% voting no, and 19% undecided.
Question 3 asks whether it should be illegal to keep animals in what advocates call ‘extreme’ conditions of confinement and illegalize the sale of meat and eggs from out-of-state farms where animals are kept in such conditions. This question garnered an overwhelming yes vote of 71%, a no vote of 12%, and an undecided vote of 17%. I have a hunch that these lopsided results are at least partially due to my wording of the question in the survey, but it’s hard to know for sure.
Question 4, which asks whether marijuana should be legalized for recreational use and regulated in the model of Colorado and other states, is the most well-known and controversial of all the questions and follows in the wake of the state’s 2008 decriminalization and 2012 medicinal marijuana questions. The results of this question were too close to call, with 49% voting yes, 43% voting no, and 8% undecided.
Again, this survey wasn’t exactly scientific and all of the presented data should be taken with a mouthful of salt. That being said, even imprecise results like these can be useful in painting a picture of what Hollistonians think, and I thank all of those who participated.
I can't tell if some of these comments are serious or sarcastic.
Ryan James | 2016-09-08 16:54:24
I didn't mean to start a debate with my comment about Harambe. I was just thinking that the loss of Harambe was a national tragedy and he shouldn't be used as a political football. Now can we please stop all this arguing?? It's what Harambe would have wanted.
Debbie Cohen | 2016-09-08 05:00:01
A Non-issue?? Clearly Chuck doesn't have any children. Just you wait until a 400 pound gorilla drags your first born into a river. The zoo made the right call. Of course it sucks to shoot an animal, but this wasn't a wild gorilla, it was captive-a shadow of his free relatives. So Chuck, maybe you should be a little bit more thoughtful of what you say. You never know who you're going to offend.
Sarah Plunkett | 2016-09-07 16:50:36
Harambe was 17 years old when he was assassinated-while posing zero risk to the child. I don't understand the mindset of "Harambe was a dangerous creature." He was a beautiful and inspiring young gorilla who should still be alive right now. Whether you support Hillary or the Donald, I think we can all agree that the Cincinatti zoo should not have resorted to lethal force over something that was practically a non-issue. Thank you.
Chuck Williams | 2016-09-07 14:43:46
Roger, I don't think Harambe would have made a good president. He was reckless and violent, there is an ugly side of Harambe that the media doesn't want you to see....
Christian Park | 2016-09-07 12:08:01
A great snapshot of our town's political views, thanks!! But in all honesty, I think Harambe would probably make a better president than either nominee put forth by the 2 major parties. lol
Roger Elder | 2016-09-07 08:11:42
Ms. Cohen, I find your finger pointing most disturbing. While getting off your high horse, you should read the article more closely. The author wasn't making a joke; He was simply commenting on what was on a ballot. And for the record, Harambe's fate was most appropriate, given the circumstances. Most Hollistonians would agree every day, and twice on Sunday's..
Stan Coffin | 2016-09-06 20:34:57
Interesting article, though i wish the author was less callous in his remarks about Harambe. 5/28/16 is a date that has been seared into the conscience of all Hollistonians, young and old, and Mr. Niermeyer should not joke about matters of animal cruelty.
Debbie Cohen | 2016-09-06 17:18:33